Data-based knowledge - Handling Data
We use data to understand and evaluate situations and to make appropriate decisions about them according to our interests or objectives.
It is necessary to become familiar with the different natures and types of data, with the tools available for its handling, with its appropriate formatting and distribution, to achieve an agile and effective support process for decision-making in organisations.
From the primary data piece to becoming part of a scorecard for decision-making in a company, the data changes its state and follows a path. This module facilitates understanding an organisation's data map and the evolution and transit of the data in it to become actionable information for decision-making.

Learning objectives
Upon completing this sub-module, you should be able to do the following:
- Identify the different natures and types of data.
- Describe the basic elements of the Business Information System of a Company.
- Interpret data and derive conclusions about efficiency, efficacy, volumetrics and ratios.
Glossary
Data piece: Concrete information on facts, elements, etc., which allows them to be studied, analysed or known. Data can come in the form of text, observations, figures, images, numbers, graphs, or symbols. For example, data might include individual prices, weights, addresses, ages, names, temperatures, dates, or distances. Data is a raw form of knowledge and, on its own, doesn’t carry any significance or purpose. In other words, you have to interpret data for it to have meaning. Data can be simple—and may even seem useless until it is analyzed, organized, and interpreted.
Quantitative Data: This is a type of data provided in numerical forms, like the weight, volume, or cost of an item.
Qualitative Data: This is a type of data descriptive, but non-numerical, like the name, sex, or colour of a person.
Data map: Diagram describing the sources, stores, process applications and flow of data in a particular organisation.
Database: A structure that is responsible not only for storing data but also for connecting them together in a logical unit. In general terms, a database is a collection of structured data belonging to the same context and, in terms of its function, it is used to manage large amounts of information electronically.
Structured data: Data directly storable in a database. Structured data is data that has been predefined and formatted to a set structure before being placed in data storage, in a structured database. The best example of structured data is the relational database: the data has been formatted into precisely defined fields, such as credit card numbers or addresses, to be easily queried. It can be human- or machine-generated.
Unstructured data: Unstructured data is data stored in its native format and not processed until it is used. It comes in a myriad of file formats, including email, social media posts, presentations, chats, IoT sensor data, and satellite imagery.
Information: Information is defined as knowledge gained through study, communication, research, or instruction. Essentially, information is the result of analyzing and interpreting pieces of data. Whereas data is individual figures, numbers, or graphs, information is the perception of those pieces of knowledge. For example, a set of data could include temperature readings in a location over several years. Without any additional context, those temperatures have no meaning. However, when you analyze and organize that information, you could determine seasonal temperature patterns or even broader climate trends. Only when the data is organized and compiled in a useful way can it provide information that is beneficial to others?
Insight: In the business world, insight is the knowledge that adds value and serves to create or improve something. A company has insights when it has valuable information that allows it to generate intelligence and understand what is happening, why and how something can be solved, reversed or improved.
Job, Task and Process: A job is a work that needs to be done. A task is a piece of work that needs to be done. The process is a series of actions that are done for a particular purpose. Job and task define the work to be done, whereas process defines the way the work can be done or how the work should be done.
Efficacy / Effectiveness: Is the output quality level of a task or the whole process – “doing the right things”
Efficiency: Is the effort level to reach an output (within an efficacy level or status) in a task or in the whole process – “doing right the things”
Volumetry (task or process): The number of events of a type that occur in a period of time within an activity or process (e.g. the number of website visits per day).
Ratio (task or process): It is the qualitative assessment of certain events within that volumetry of events (e.g. the number of times a particular banner was clicked on during the visit to the website).
Intro video
Learning content
Data Literacy Importance for Business Industry 4.0 Implementation
There are several applications and benefits that companies get from Industry 4.0 implementation. As we established in Module 0:
“The term Industry 4.0 refers to a new stage within the organisation and control of the industrial value chain: the so-called fourth industrial revolution. This era corresponds to the digital transformation of manufacturing/production and value-creation processes.
Through an amalgamation of mechanical and digital technologies, it has been possible to make products and means of communication, making them networked, and providing several new opportunities for the production of goods and services.
Industry 4.0 is based on cyber-physical systems, embedding software systems and disposing of an Internet address to connect and be addressed via the Internet of Things (IoT), the key component of a smart factory. The floor of a smart factory is indeed equipped with sensors that contain an IP address, which allows the machines to connect with other web-enabled devices (go further for more details).
In this way, the collection, analysis and exchange of large amounts of valuable data become easier and more efficient: the decision-making process is facilitated, since it is possible to create higher value when data from production operations is combined with operational data from the supply chain, customer service or other enterprise systems.
The use of high-tech IoT devices leads to higher productivity and improves the quality of processes and results. When a factory replaces manual inspection business models with Artificial Intelligence-powered visual insights manufacturing errors are reduced and lots of money and time are saved.”
So let us start to create the necessary data culture and familiarity through this Module.
Identifying the different natures and types of data
To correctly interact with your company or organization, you must become familiar with the different natures and types of data you will find. As stated in the glossary, data are information on facts, elements, etc., allowing it to be studied, analyzed or known. Data have several different sources, from text, observations, figures, images, numbers, graphs, or symbols.
We use data to understand a business or life situation and act. For problem understanding, data should be connected and conformed until they reach a meaning for us; they give you insights about the situation that allows you to decide a course of action according to what you need or what your goals are.
Data production source: Human and Machine data
Data come from two main kinds of sources:
- Human-generated data is comprised of emails, text documents, spreadsheets, presentations, images, audio, and video files that we create and share with other people every day.
Machine-generated data is information automatically generated by a computer process, application, or another mechanism without the active intervention of a human.
Machine Data is defined as the digital information automatically generated by the activities of networked machines — these include physical devices, as well as the applications, software, and clouds they’re linked to. These “machines” are often known as the Internet of Things (IoT), for example:
- Computers
- Smartphones
- Smart Assistance
- Sensors
- Cloud Software
- Websites
- Refrigerators
- Airplanes
- Elevators
- Traffic Lights
- Thermostats
- Smartwatches
- ATMs
- GPS Devices
- Driverless Cars
Remember, Machine Data must be automatically generated — this means that data manually entered by a human user can never be considered.
Data types: Quantitative and Qualitative data
When you have to measure something within a specific category, horses, in a context, for example, Spain in 2019, you use quantitative data. The data sets a numerical value: 722,158 horses censused.
When you have to describe an element, a horse in our example, within that category, you use qualitative data—for example, identifying female and male horses within the census. Female and male are qualitative data.
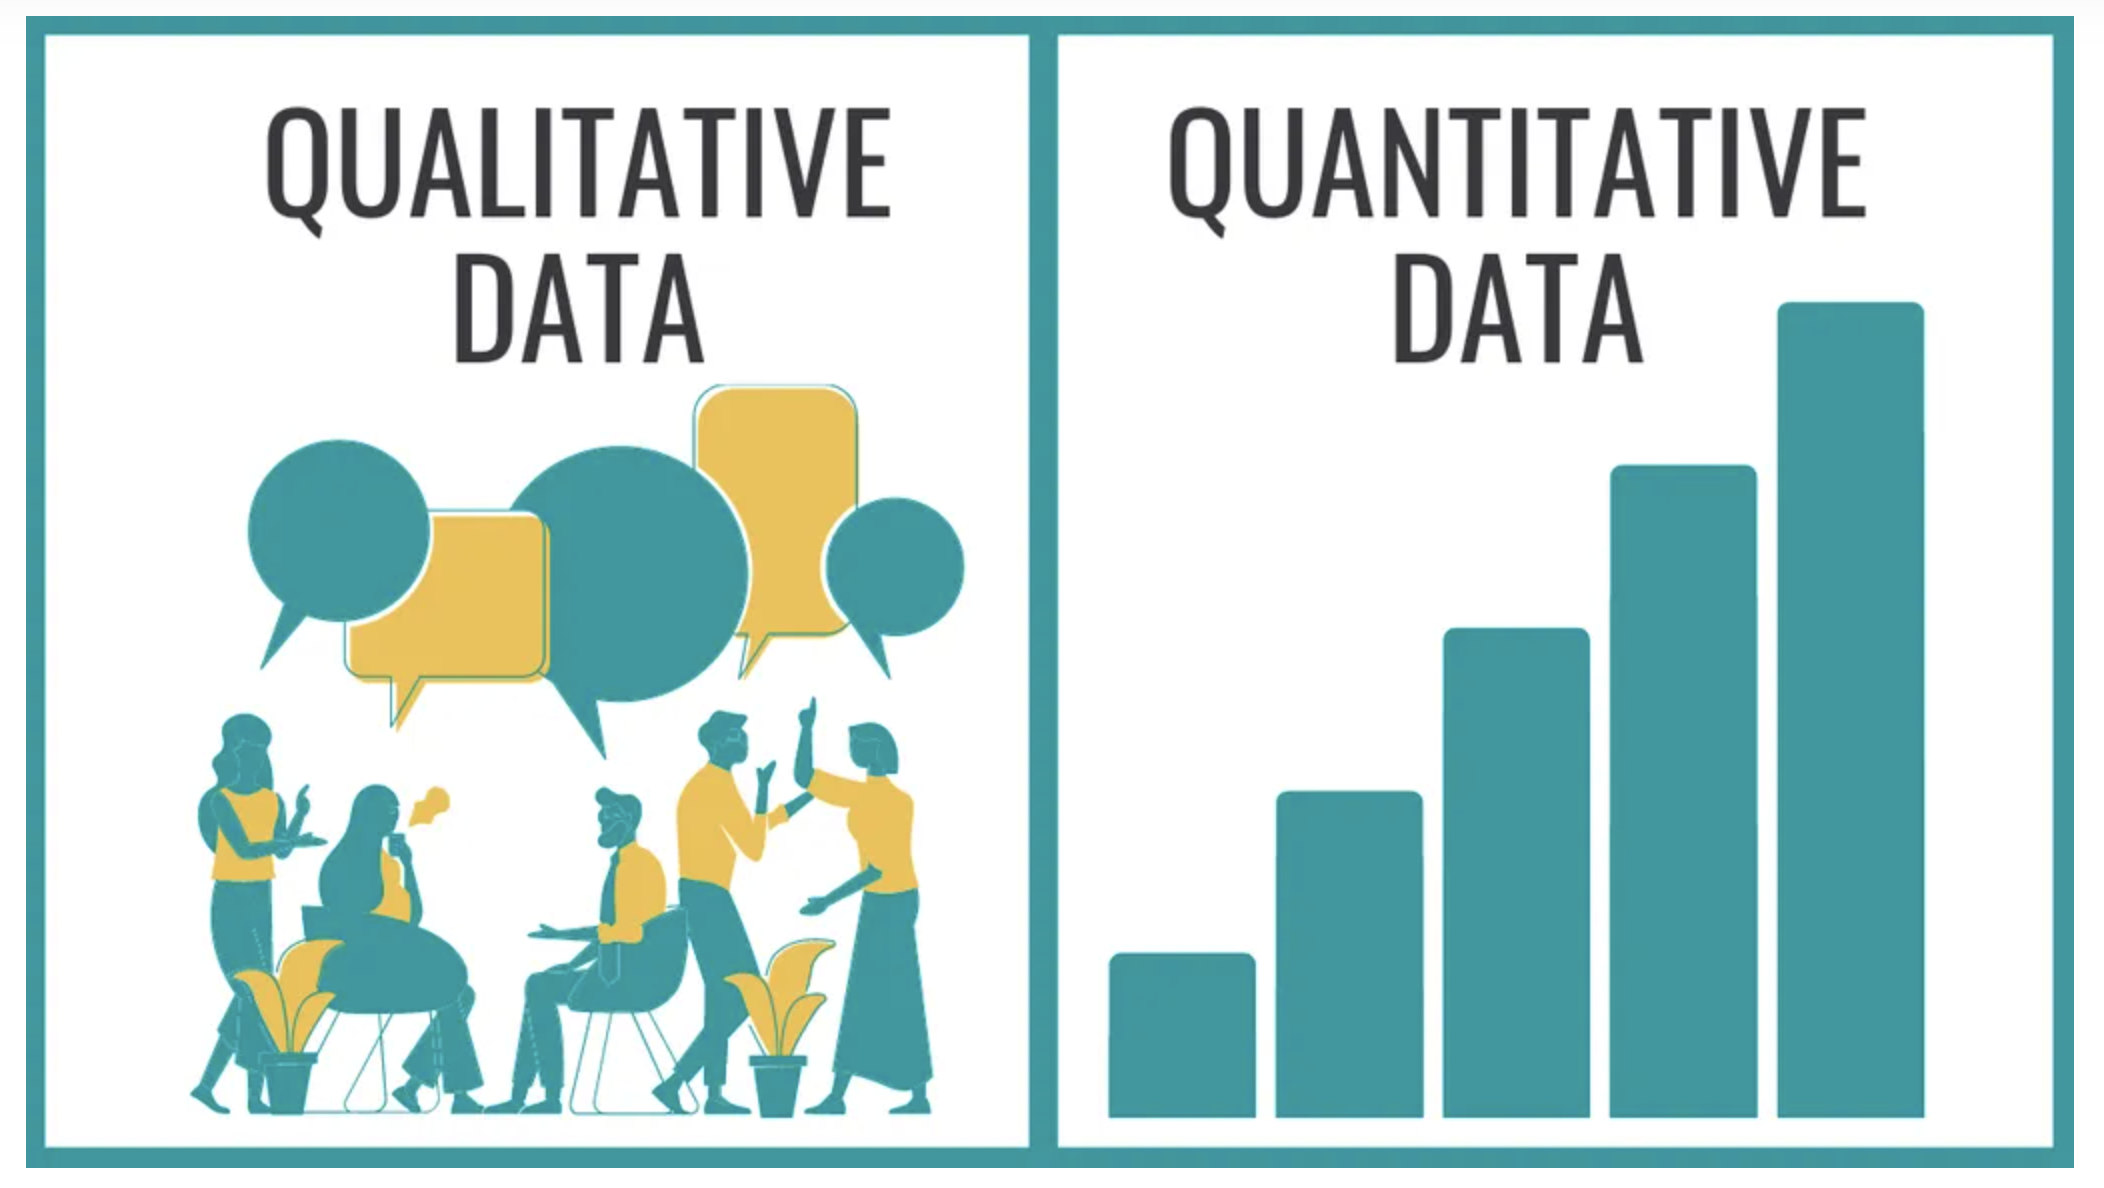
Source: Jonathan Sandling
In a survey, which is a standard tool for collecting data on a situation or problem to be investigated, quantitative questions are answered with a number. In contrast, you will respond to qualitative questions with a category (horse, donkey, etc.) or a subcategory (female or male) formed based on quality. Unstructured qualitative data (see glossary) typical for a company are the comments on satisfaction with the product that the customer leaves in the online shop.
Data nature: Structure Data and Unstructured Data
We can classify the data attending to its nature in structured and unstructured data (see glossary definitions), and they can be deployed as follow:
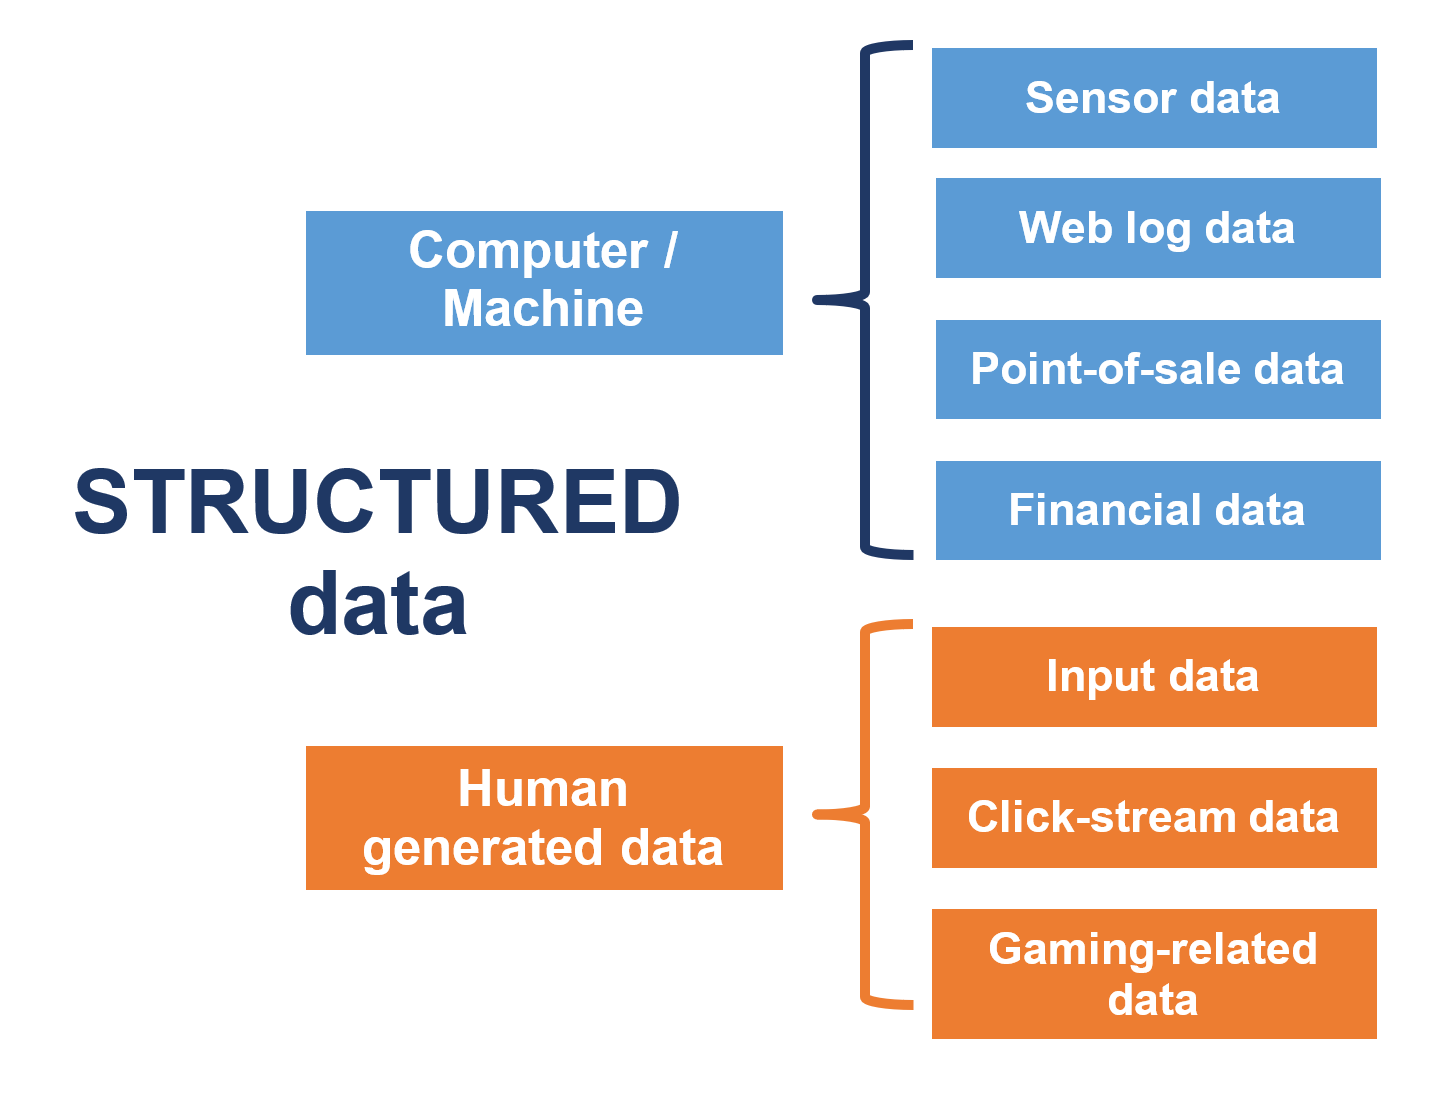
Source: own elaboration
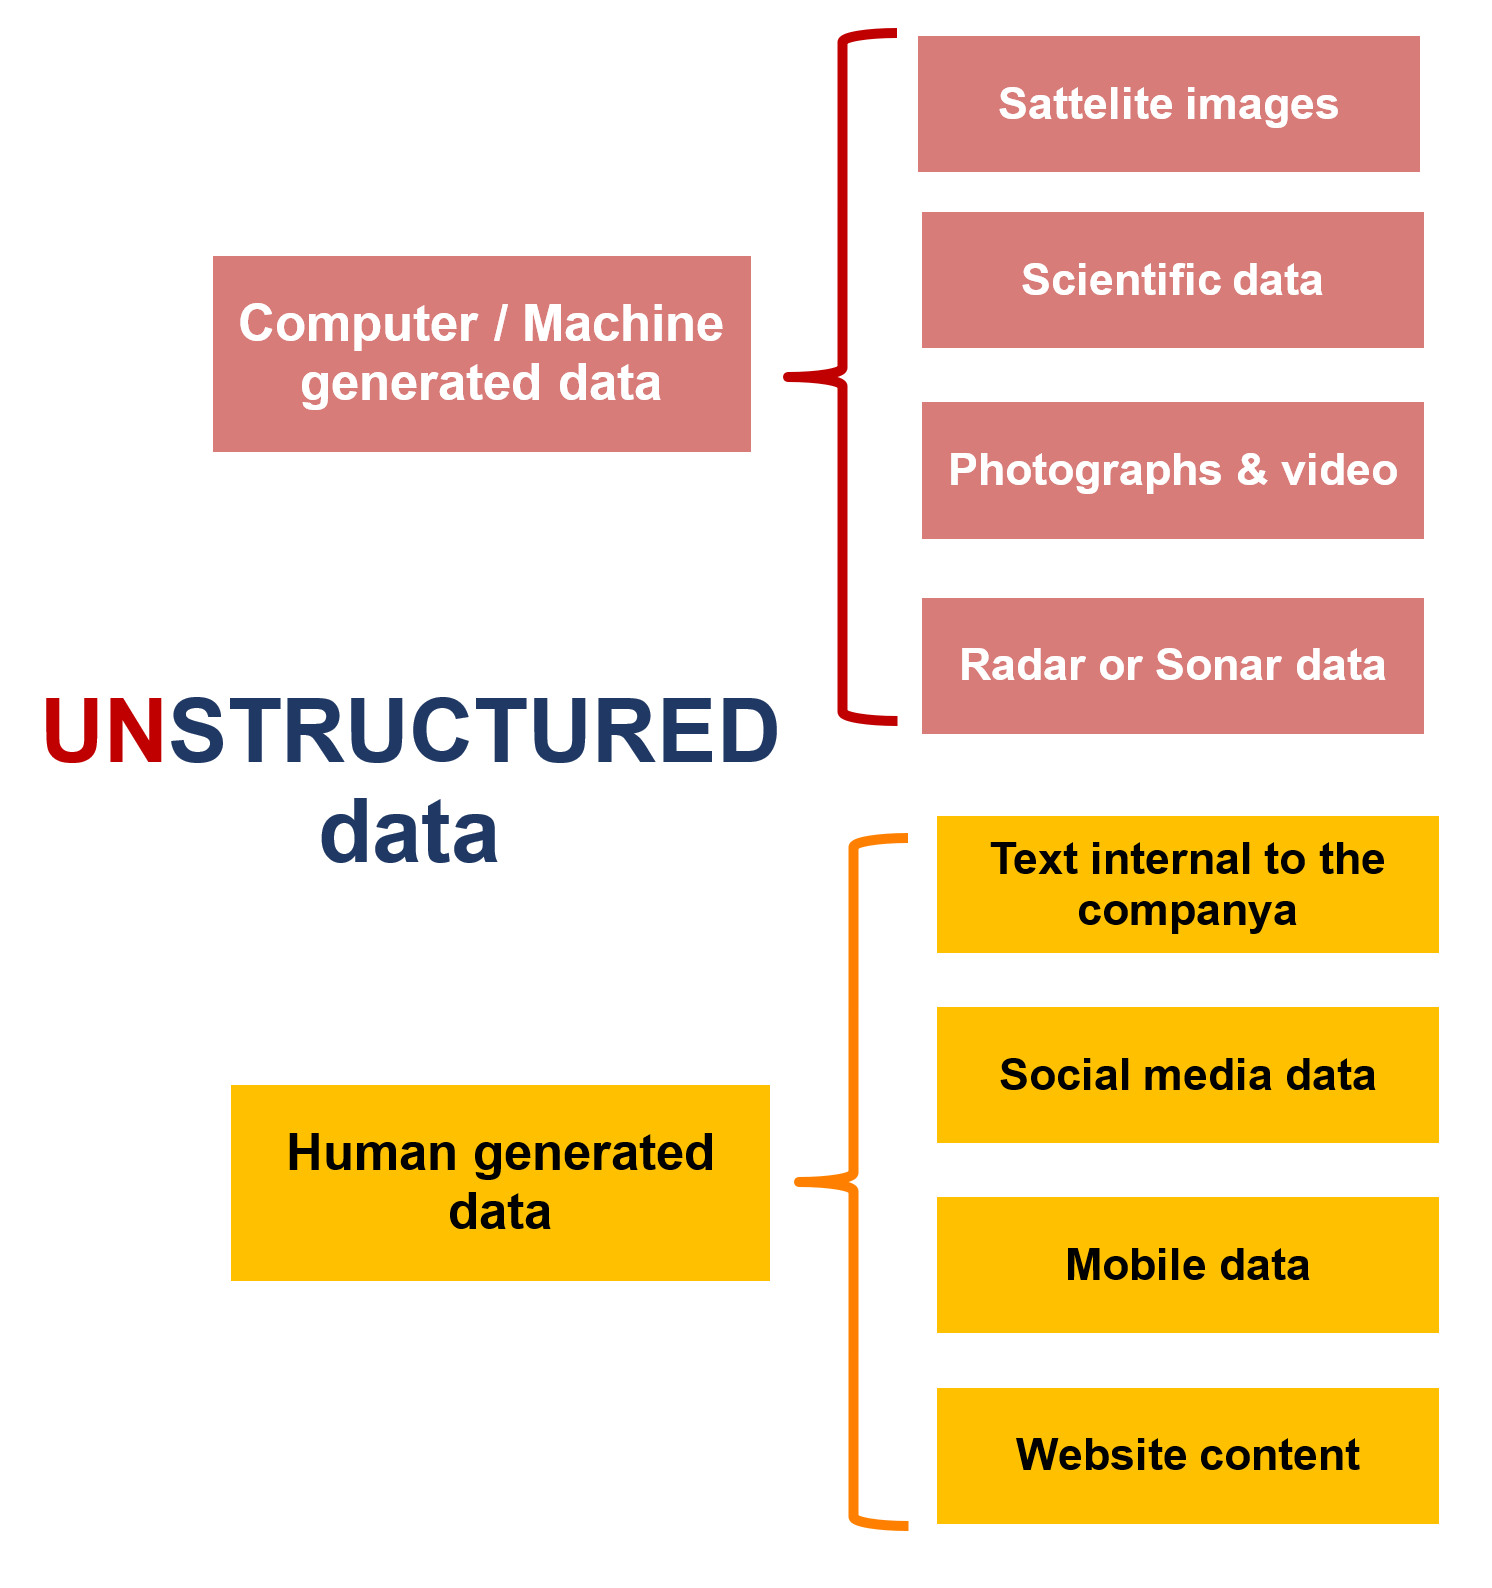
Source: own elaboration
Describing the Basic Components of the Business Information System.
In order to manage data and create information addressed to operate or to gain insight related to the data context, a company needs an Information System.
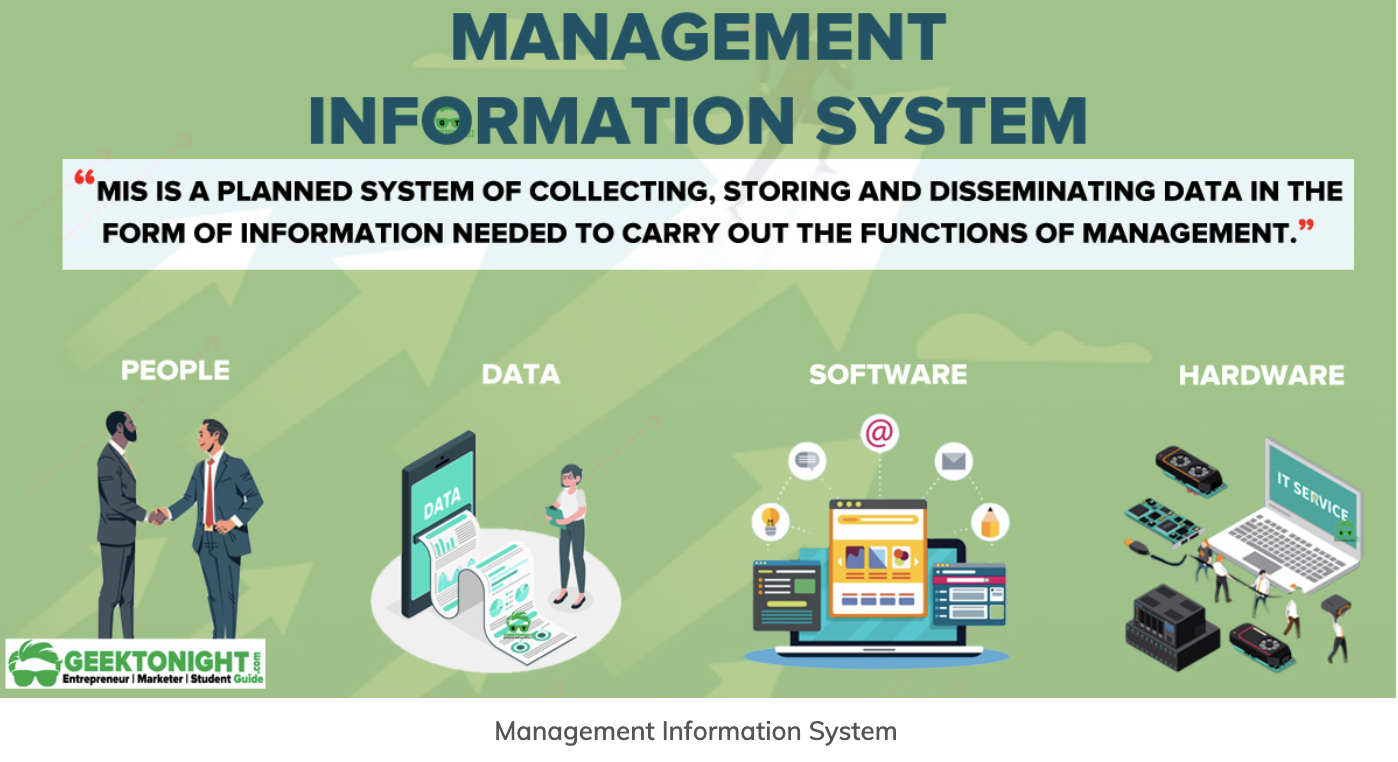
Source: https://www.geektonight.com/
The basic components of a Business Information System are:
- Computer hardware
- Computer software for data processing and business applications on premise/cloud computing
- Data flow: Data inputs / Data sources / Data outputs
- Data storage: data sources and data sets on premise/cloud storage
- System administration: users, licenses, procedures, and gadgets.
- Cybersecurity tools and systems
Using and Interpreting data
Identifying metrics, KPIs and CSFs
As we stated previously, data are used in business to measure the situation/problem composition, measure the output or performance evolution, and measure the effort and the rest of the aspects involved in reaching that output. In this measurement process, we will deal with different measurement levels: metrics, KPIs and CSFs. Let´s go a little bit deeper.
There are two types of metrics
- Lagging metrics, such as revenue, profit and cost, are backwards-focused and inform you about the outcome of past actions.
- Leading metrics, on the other hand, help you understand the likelihood that your product will reach its goal in the future (product quality, sales quality, component consolidation, net promoter score -nps-, etc.).
All KPIs are metrics, but not all metrics are KPIs. A metric is just a measure, while a KPI is one or more combined metrics oriented to a business goal.
KPIs are metrics used to evaluate factors that are crucial to the success of an organization (CSFs); targets are specific goals for those indicators.
METRIC -> KPI -> CSF

Source: https://www.geektonight.com/
Business Data Growth drivers: Efficiency and Efficacy KPIs, Volume and ratios.
There are several ways to improve the results of a business and all of them will be shown in the business information system, but they will come from different “sources”.
Efficiency. Efficiency data conduct to two different business results:
- a reduction of the effort used to reach the activity or process output during a certain period.
- A better use of the capacity of a resource, means resource productivity improvement, that allows the company to grow without additional investments in capacity.
Efficacy. Efficacy improvement has several good impacts on the business, but here, from the company growth perspective, especially from the resource usage point of view, efficacy means the quality of the results. Output Quality Assurance (QA), means that all the effort and capacity used to create an output item is possible to be directly converted in a transaction with a potential customer. In this sense, efficacy means control over the capacity usage and no need to rework insufficient outputs.
Volume and Ratios. Within a process or an activity you can increase the resulting amount:
- managing the activity or process volume per period. For example, you can get more from the sales closing process by just having more sales closing interviews per period. More interviews (activity flow/volume) per period, with the same closing success ratio, means more sales closed per period.
- Maintaining the flow/volume, means the same sales closing interview per period, but increasing your closing success ratio drives to more sales closed per period.
Sometimes it is easier, or more strategically convenient, to drive growth by doing things better (increasing the success ratio), but sometimes it is not possible or not convenient, and then the growth could come from doing things at the same efficacy level but increasing the volume of things done during the period (increasing the activity flow/volume)
Defining Business Dashboards to get Scorecards.
A performance scorecard is a graphical representation of the progress over time of an enterprise, toward some specified goal. Performance scorecards are used to monitor the progress of any organizational goal. The integral concepts of scorecards are targets and key performance indicators (KPIs). KPIs are metrics used to evaluate factors that are crucial to the success of an organization; targets are specific goals for those indicators.
The Scorecard concept could be exemplified following the example of a car dashboard. On the car dashboard, we don’t have information on all the things that are happening in the car engine and other systems, we should have all the indicators that are crucial for efficient, safe and comfortable driving. Part of those indicators (KPIs) could be associated with efficient driving (fuel consumption, engine rpm, gps assistant, etc.), part with comfort (inside temperature, multi etc.), part of some are related to safe driving (the different safe assistants implemented, safe belts and airbag control, etc). Efficient driving, Comfortable driving and Safe driving are the Critical Success Factors (CSFs) of our example and could be implemented mixed in a common dashboard or in specific dashboards addressed to each CSF (efficiency, comfort and safe dashboards). Scorecard is the value that a Dashboard offer in a moment or in a time period.

Source: Image by macrovector on Freepik
Case study
THE CONTEXT

Source: www.grefusa.com
Grefusa is a well-known snack manufacturer in Spain. Grefusa sells in the Spanish market famous brands such as "Mr Corn" corn, "El Piponazo" sunflower seeds, "Papa Delta" wheat snacks and many other leading brands in its market.

Source: www.grefusa.com
Grefusa sells its products through different sales channels, but one of the most important for Grefusa is the self-sale routes that serve the small shops where mainly children and young people buy its products.
THE PROBLEM A
A fundamental problem for Grefusa is organising the sequence of customer visits within each working day of the route. With a weekly frequency, the sales visit has a cost (visit cost metric), with which a KPI is built, a break-even point of profitability of commercial attention to self-sale customers. To calculate this KPI, first, the metric of the cost of each visit is calculated, adding up all the costs generated on a route day (salaries, fuel, depreciation, etc.) and dividing them by the standard number of customers visited on a route day, a working day. The amount that comes out as the cost of the visit must be covered by the margin of the product sold during the visit. With this calculation logic, it is established that for the weekly visit to be profitable, at least 20 euros must be sold to the shop at that visit.
THE SOLUTION A
When this sales figure is not reached, using a criterion of economic cost efficiency, the customer's status is changed to "fortnightly visit customer". With this change, it is expected that, by accumulating the purchase of two weeks in the fortnightly visit, the figure of 20 euros will be reached, reaching the break-even point of profitability of the sales visit.
THE PROBLEM B
In these routes, using logistical efficiency criteria, the customers are visited following a sequence based on geographical proximity, from the closest to the furthest in the outward direction and from that point, the return to the starting point of the route begins, usually the Grefusa warehouse in the area.
Through the analysis of the commercial conditions of the different types of customers (some have retail credit while other types of customers are strictly cash-on-delivery), commercial data analysts detected that this practice of organising the route had to be modified.
Because children's kiosk-type customers are strictly cash customers, the salesperson should not visit them before they have made their sales to their customers, children, which occurs after they leave school, in Spain, at around 17:00 hours.
Next to that kiosk, there may be a bakery; this shop type (analysing our sales history) sells much more if visited around 10:00 in the morning.
THE SOLUTION B
Putting the two analyses together, it turns out that two customers who are physically next to each other, from the point of view of sales efficiency, are 7 hours apart. We can solve this situation by visiting the bakery at the beginning of the route, and the children's kiosk at the end of the day on the way back to the warehouse.
LESSON LEARNT
In this case, what becomes clear is that intelligent attention to the data available to the company allows changing the logic of action, giving prevalence to the criterion of effectiveness of the visit rather than the cost efficiency of the visit. Grefusa obtained excellent results by implementing this change of approach in its more than 400 sales routes.
Questions and answers
Q1: In a company's goal structure, which measure is higher level, the CSF or the KPI?
A1: The CSF (Critical Success Factor) is hierarchically higher; usually, a CSF will be aligned with a series of KPIs (Key Performance Indicator) that explain how to achieve the CSF, and in turn, the KPIs will be supported by more straightforward metrics...
Q2: What is the difference between a Scorecard and a Dashboard?
A2: A Dashboard is a control panel of an activity or process, whereas a Scorecard shows the specific values that a Scorecard shows at a particular point in time.
Q3: When we try to improve the outcome of a process by attacking a success rate, what are we affecting, efficiency, effectiveness or volume?
A3: Improving the ratio is about improving the effectiveness of the process. Increasing the success rate means more targets are achieved per unit processed. For example, an improvement in the conversion rate of a customer funnel means that for x customers that go through the funnel, the number of them that take the call to action in the funnel increases.
References
Paul W. Farris, Neil T. Bendle, Philip E.Pfeiffer y David J. Reibstein. Marketing Metrics 2nd Edition, PEARSON
Cole Nussbaumer Knaflic, Storytelling with Data: A Data Visualization Guide for Business Professionals 1st Edition. Wiley 2015
Additional resources
Structured vs. Unstructured Data: A Complete Guide. Talend.
Data vs Information: What’s the Difference? Bloomfire.
https://blog.kale.bismart.com/que-es-un-insight-ejemplos-de-insight-marketing
What is an insight? Kale.
https://www.techtarget.com/searchbusinessanalytics/definition/performance-scorecard
Performance Scorecard. Techtarget.
https://jonathansandling.com/using-qualitative-and-quantitative-data-to-make-decisions-in-business/
Quantitative and Qualitative Data. Jonathan Sandling.